Dissertation Analysis Help for Checking Statistical Assumptions
By Writing Gram • Oct 11, 2026
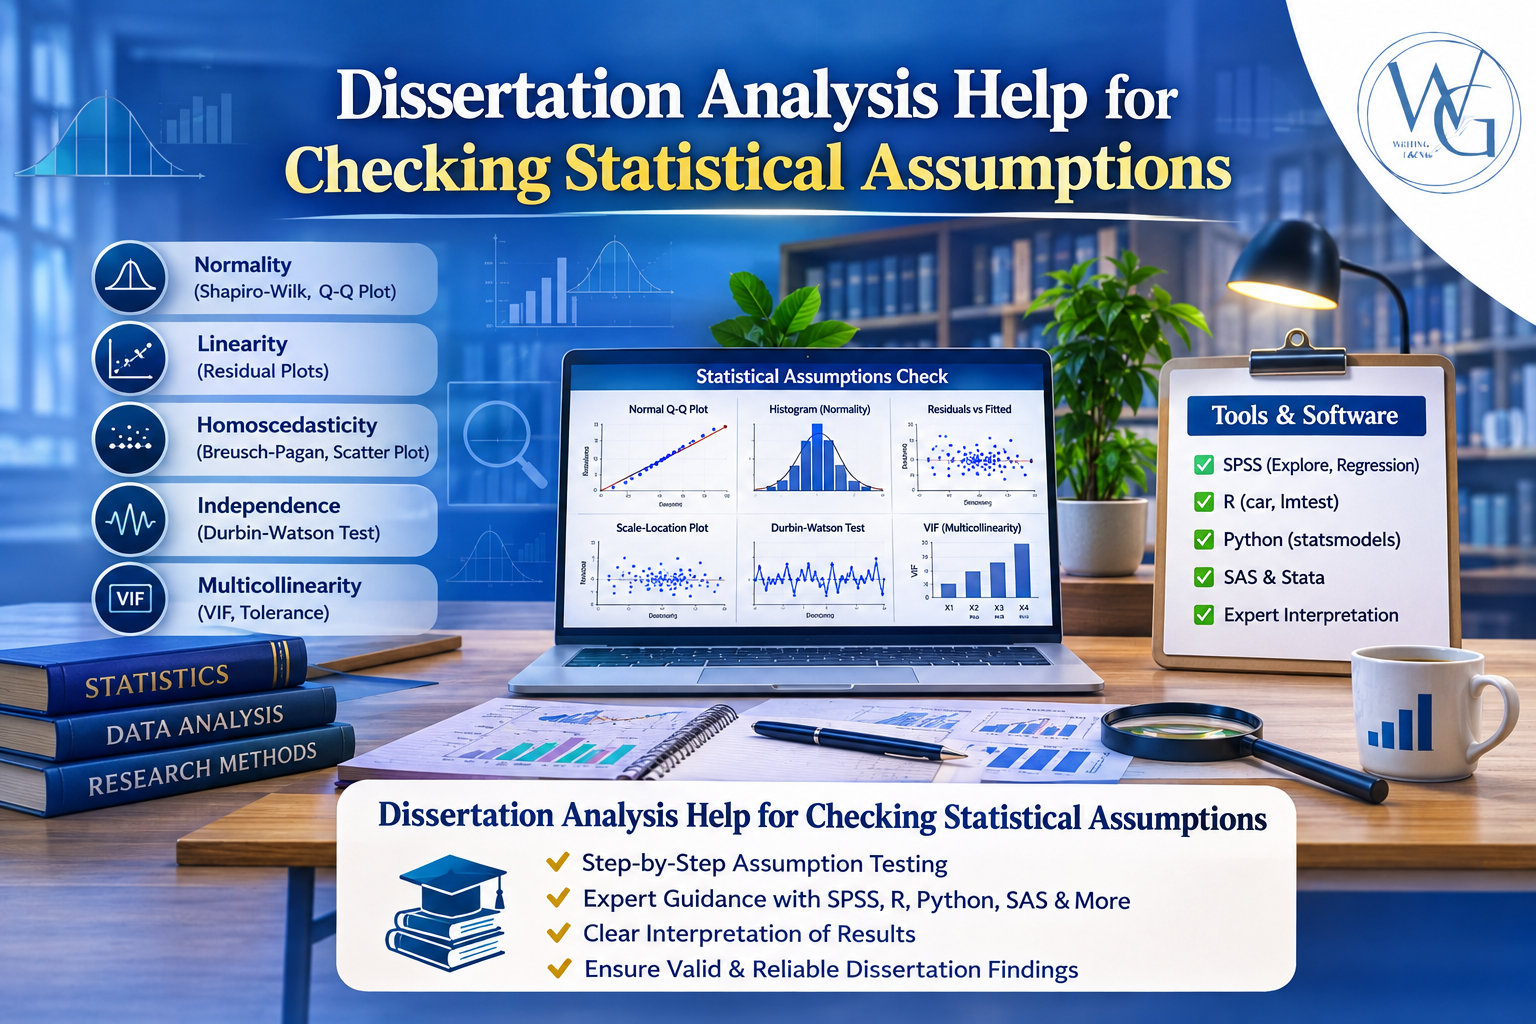
Get dissertation analysis help checking statistical assumptions in SPSS, reviewing test suitability, and addressing problems before reporting your results.
Dissertation statistical assumptions are conditions that must be considered when selecting and applying a statistical procedure. The appropriate checks depend on your research design, variables, and chosen test. Dissertation analysis help can assist you in reviewing test suitability, examining diagnostic output, and identifying potential problems before you report your findings.
Why Checking Statistical Assumptions Matters in a Dissertation
Running a statistical test does not automatically mean it is appropriate for your data. Overlooked assumptions can affect standard errors, confidence intervals, p-values, coefficient estimates, or conclusions, depending on the method and the problem.
For example, you might run a multiple regression in SPSS and obtain a statistically significant result. However, if you have not examined potential multicollinearity, nonlinear relationships, or unequal residual variance, you may not yet have enough information to determine whether your model adequately supports your conclusions.
Checking assumptions helps you identify issues that require investigation before completing your dissertation's results and discussion chapters.
Get Your Dissertation Statistical Assumptions Checked Before You Submit
Not sure whether your statistical tests are suitable for your data or whether you have checked all the relevant assumptions? Writing Gram can help you review your chosen tests, examine your SPSS output, identify potential problems, and understand what needs attention before reporting your findings.
Get help resolving statistical uncertainties, making informed analytical decisions, and explaining your results more clearly in your dissertation.
👉 Place your order now to get help checking your statistical assumptions and identifying potential problems before you finalize your dissertation.
Which Statistical Assumptions Should You Check?
The statistical assumptions you need to check depend on your research question, the type of data you collected, and the analysis you selected. Checking the relevant assumptions can help you identify potential problems, assess whether your chosen method is appropriate, and explain your findings accurately in your dissertation.
Before running your final analysis or reporting your results, it helps to understand which checks apply to your specific statistical procedure and how to interpret the findings.
Normality and the Distribution of Residuals
Normality is relevant to some statistical procedures, but it does not mean every variable in your dataset must follow a normal distribution. For ordinary linear regression, the normality assumption generally concerns the model errors and is particularly relevant to conventional statistical inference in smaller samples. The regression predictors themselves do not need to be normally distributed.
Depending on your analysis, useful checks may include:
Histograms: Help you examine the shape of a distribution.
Normal Q–Q plots: Help you assess whether residuals or other relevant data follow a pattern consistent with a normal distribution.
Residual diagnostics: Help you identify unusual patterns that may affect the suitability of your model.
For t-tests and ANOVA, the relevant normality assumption depends on the specific procedure and study design. For example, some procedures concern the distribution of errors within groups rather than requiring every variable in the dataset to be normally distributed.
Independence of Observations or Errors
Independence concerns whether observations or model errors meet the independence requirements of the selected statistical method. This assumption deserves particular attention when your data include repeated measurements, participants grouped within schools or hospitals, or observations collected over time.
If your observations are dependent, a conventional analysis may underestimate uncertainty or produce misleading standard errors and significance tests.
When reviewing independence, consider:
How participants were recruited and how the data were collected.
Whether participants belong to groups that could influence their responses.
Whether repeated measurements or time-related patterns are present.
Whether your selected method accounts for clustering, repeated measures, or other forms of dependence.
A diagnostic test may help identify certain patterns, but it cannot replace an examination of the study design. The appropriate approach depends on how the data was collected and what your statistical model can accommodate.
Homoscedasticity and Equal Variance
Homoscedasticity means that the errors in a regression model have approximately constant variance across the relevant range of predicted values. If residual variability changes substantially, the usual regression standard errors and statistical tests may be unreliable unless the analysis accounts for that pattern.
A residuals-versus-fitted-values plot can help you look for signs of changing variability, such as a fan-shaped pattern.
Equal group variances are related but distinct. They are relevant to certain comparisons between groups, including conventional one-way ANOVA. The assumption and the appropriate diagnostic depend on the test you are using. Some alternatives, such as Welch’s ANOVA, do not require equal group variances.
Multicollinearity and Linearity
In multiple regression, multicollinearity occurs when two or more predictors contain overlapping information. Strong multicollinearity can make individual coefficient estimates less stable and increase their standard errors, making it harder to determine the separate contribution of each predictor.
You can investigate potential multicollinearity using:
Correlation matrices to examine relationships between predictors.
Tolerance statistics and variance inflation factors (VIFs) to assess how strongly predictors are associated with the other predictors in the model.
Interpret these measures in context rather than relying on one universal cutoff.
Linearity is another consideration in ordinary linear regression. It concerns whether the model appropriately represents the relationship between predictors and the outcome. Scatterplots, residual plots, and other suitable diagnostics can help reveal patterns that a straight-line relationship may not capture.
National University identifies linearity, independence of errors, constant error variance, and the absence of problematic multicollinearity as important assumptions to consider in multiple linear regression. It also explains the need to examine whether the regression model meets these assumptions before interpreting its results.
Measurement Levels and Test Suitability
Your variables' measurement levels, roles, and distributions also influence which statistical method is appropriate. For example, a continuous outcome, an ordinal response, and a nominal category may require different analytical approaches depending on your research question and study design.
Before interpreting your results, check whether:
Your selected test matches the research question and hypotheses.
The outcome and predictor variables are suitable for that procedure.
The study design and sampling approach are consistent with the method's requirements.
The assumptions relevant to the chosen test have been assessed.
Any limitations or departures from assumptions have been considered when interpreting the findings.
The Pennsylvania State University Department of Statistics explains that regression residuals should be examined to assess whether the model’s assumptions are reasonable. For your dissertation, this means checking residual plots for patterns that may indicate nonlinearity or unequal error variance, and considering whether the errors meet the relevant independence and normality assumptions before interpreting your regression results.
Preparing Your Statistical Results for Dissertation Submission
Checking your statistical assumptions is only one part of preparing your dissertation for submission. Before uploading your final document to ProQuest, your university's institutional repository, or another approved repository, review your analysis, research evidence, citations, and document formatting to make sure everything is complete, accurate, and consistent with your institution's requirements.
Depending on your university's instructions and the stage of your research, your final checks may include:
Reviewing statistical reporting: Confirm that your reported tests, statistical values, degrees of freedom, p-values, confidence intervals, and effect sizes are accurate where applicable.
Addressing missing data and incomplete datasets: Check for missing responses, incomplete records, or gaps in your dataset. Assess how these affect your analysis, document how missing data were handled, and explain any limitations. Do not fill gaps with invented values or make unsupported assumptions about missing information.
Integrating relevant new research: If important studies have been published since you completed your literature review, assess whether they are relevant to your research question and findings. Update the affected sections and incorporate appropriate citations where necessary, while checking whether the new evidence changes your discussion or interpretation.
Checking consistency: Make sure your methods section explains the analysis you actually performed and that your results and discussion accurately reflect your findings.
Reviewing tables and figures: Check titles, labels, notes, numbering, and references to each table or figure in the text. Ensure they agree with the results reported in the main text.
Fixing formatting, citations, and references: Check page numbering, headings, margins, and table placement against your university's formatting requirements. Correct missing in-text citations, incomplete reference entries, incorrect publication details, broken links or DOIs, and inconsistencies in your required referencing style. Ensure that cited sources appear in the reference list and that every reference-list entry is cited where required.
Following repository requirements: Check your university's guidance on file format, required forms, copyright permissions, embargoes, and any additional submission steps for ProQuest or the relevant institutional repository.
Requirements vary between institutions and repositories, so consult your university's official dissertation submission guidance and the relevant repository instructions. A statistically sound dissertation may still need corrections to its data documentation, citations, references, or formatting before it is ready for deposit.
If you are unsure whether your analysis meets the requirements of your research design, having your statistical work reviewed before submission can help you identify issues that need attention and prepare your results for accurate reporting.
Frequently Asked Questions About Dissertation Statistical Assumptions
1. What Are Statistical Assumptions in a Dissertation?
Statistical assumptions are conditions that a statistical method relies on to produce appropriate estimates, standard errors, confidence intervals, or hypothesis tests. Depending on the method, these assumptions may concern normality, independence, equal variance, linearity, or multicollinearity. Checking the relevant assumptions helps you determine whether your chosen analysis is suitable for your data and research question.
2. Which Statistical Assumptions Should I Check for My Dissertation?
The assumptions depend on your statistical test and research design. For example, linear regression may require checks for linearity, independent errors, constant error variance, and potential multicollinearity. Certain t-tests and ANOVA procedures require attention to normality and group variances. Identify the assumptions for your specific method rather than applying the same checklist to every analysis.
3. How Do I Check Statistical Assumptions in SPSS?
The checks depend on the analysis you are conducting. In SPSS, you may use histograms, normal Q–Q plots, residual plots, tests of homogeneity of variance, or collinearity statistics. For regression, residual diagnostics can help identify potential nonlinearity or unequal error variance, while tolerance and variance inflation factors can help assess multicollinearity. Interpret each output in the context of your model and study design.
4. Can I Report My SPSS Results If a Statistical Assumption Is Violated?
Yes, in some cases, but you should first assess how the violation affects your analysis. Some statistical procedures tolerate certain departures from their assumptions, while others may require an alternative test, a suitable model, or an adjustment to the method of inference. Explain the issue, justify any changes, and report the limitations transparently rather than ignoring the violation.
5. What Should I Do If My Dissertation Data Is Not Normally Distributed?
First, determine whether normality is actually required for your chosen procedure and which distribution matters. For example, ordinary linear regression generally concerns the distribution of errors for conventional small-sample inference, not whether every predictor is normally distributed. Depending on your research design and data, an alternative method or an appropriate adjustment may be suitable. Do not transform data automatically without considering whether the change is justified.
6. What Happens If My Regression Model Has Multicollinearity?
Multicollinearity can make individual regression coefficient estimates less stable and increase their standard errors, making it harder to distinguish the separate contributions of related predictors. You can investigate the issue using correlation matrices, tolerance statistics, and variance inflation factors (VIFs). The appropriate response depends on your research objectives and model; removing a predictor solely to obtain statistically significant results is not a sound solution.
7. How Should I Handle Missing Data Before Dissertation Statistical Analysis?
Start by identifying the missing values, determining how much data are missing, and examining whether the missingness may affect your results. The appropriate treatment depends on the amount and pattern of missing data, the variables involved, and the assumptions of the selected method. Possible approaches include suitable imputation methods or analyses designed to handle missing data. Document your decision and its limitations, and never replace missing values with invented observations.
8. Can I Change My Statistical Test If My Data Do Not Meet Its Assumptions?
You may need to consider an alternative test or model, but the decision should be based on your research question, study design, measurement levels, and the nature of the assumption violation. Depending on the situation, a different test, a robust method, or an appropriate adjustment may be suitable. Explain and justify the choice in your methodology rather than selecting a method simply because it produces a preferred p-value.
9. What Should I Include When Reporting Statistical Assumption Checks in My Dissertation?
Report the assumptions relevant to your analysis, how you assessed them, and what you found. Where appropriate, include diagnostic plots, test statistics, p-values, or other supporting evidence. Explain any violations, adjustments, or alternative methods used, and describe how these decisions affect the interpretation of your results. Follow your university's reporting guidelines and the conventions of your discipline.
10. Can Writing Gram Help Me Check Statistical Assumptions for My Dissertation?
Yes. Writing Gram offers dissertation analysis assistance for students who need help reviewing their statistical methods and results. You can request help examining relevant SPSS output, checking whether your selected procedure is appropriate, identifying potential assumption violations, and understanding what may need further attention before you report your findings.
11. Can Writing Gram Help Me Fix Problems in My Dissertation Data Analysis?
Writing Gram can help you review specific statistical analysis concerns, including assumption checks, interpretation of output, and inconsistencies between your methods and reported results. The appropriate assistance depends on your dataset, research question, and the issue you need to resolve. Providing your research objectives, chosen statistical method, and relevant output can help clarify the work required.
12. Should I Check Statistical Assumptions Before Submitting My Dissertation to ProQuest?
Yes. Before submitting your dissertation to ProQuest or your university's institutional repository, review the assumptions relevant to your analysis and make sure your methods, results, tables, and conclusions are consistent. Also check your university's requirements for formatting, citations, references, and electronic submission. Repository acceptance and formatting requirements vary, so consult your institution's official guidance before uploading the final document.
13. Which Assumptions Should I Check for Survival Analysis in SPSS?
For survival analysis in SPSS, the assumptions you need to check depend on the method you use. For a Kaplan–Meier analysis, consider whether censoring is appropriately handled and whether the groups are suitable for comparison. For a Cox proportional hazards regression, check the proportional hazards assumption, assess the influence of relevant covariates, and examine whether the model is appropriate for your data. Reviewing these assumptions can help you identify potential problems before interpreting hazard ratios, survival estimates, or group comparisons in your dissertation.
How Dissertation Statistical Assumptions Are Checked in SPSS
Checking statistical assumptions in SPSS involves more than running one automated test. The right checks depend on your research question, the type of data you collected, and the statistical method you plan to use. A systematic review helps you identify potential problems and determine whether your analysis is appropriate before reporting your findings.
Step 1: Confirm That Your Statistical Method Is Appropriate
Before checking assumptions, review your research question, hypotheses, and study design. Identify your dependent and independent variables, their measurement levels, and the statistical procedure you selected. Make sure the method is suitable for your data and research objectives.
Step 2: Check Your Dataset for Problems
Before running diagnostic tests, review your data for issues that could affect the analysis, including:
Missing data: Identify incomplete records and assess how missing values may affect your analysis.
Coding errors: Check for incorrect values, inconsistent category codes, and variables entered using the wrong measurement scale.
Unusual observations: Identify outliers or influential cases that may affect your results, then investigate them rather than automatically deleting them.
Sample structure: Check whether your data include repeated measurements, clustered participants, or other features that may affect independence.
Step 3: Run the Relevant Diagnostic Checks in SPSS
The checks you need depend on your chosen statistical procedure. For example, if you are conducting multiple linear regression, you may need to examine the following assumptions and diagnostic measures:
Linearity: Use scatterplots and residual plots to assess whether the model adequately represents the relationships between predictors and the outcome. A curved or systematic pattern in a residual plot may indicate that the model does not adequately capture the relationship between the variables. The Pennsylvania State University explains how to identify regression problems using residual plots.
Normality of residuals: Use histograms and normal Q–Q plots to assess whether the residuals are reasonably consistent with normality when this assumption is relevant to your analysis.
Constant error variance: Examine residuals-versus-fitted-values plots for patterns that suggest changing residual variability. A noticeable change in the spread of residuals may indicate unequal error variance.
Multicollinearity: Review tolerance statistics and variance inflation factors (VIFs) to identify potentially problematic relationships between predictors that could make regression coefficient estimates less stable.
Independence of errors: Consider your study design and use appropriate diagnostic methods where relevant. A statistical test alone cannot establish independence when the data collection process creates dependence.
Influential observations: Examine suitable diagnostic measures to identify cases that may disproportionately affect the fitted model. Investigate unusual observations before deciding whether any action is warranted.
These examples apply to regression and should not be treated as a universal checklist for every statistical procedure. Other analyses, such as t-tests, ANOVA, logistic regression, and survival analysis, require checks suited to their own assumptions.
Step 4: Interpret the Results Together
Do not rely on a single p-value or diagnostic plot to decide whether your analysis is appropriate. Consider the statistical output alongside the plots, your sample size, the study design, and the assumptions of the selected method. A significant diagnostic test does not automatically mean your analysis is invalid, and a nonsignificant result does not prove that every assumption has been met.
Step 5: Document Your Findings and Any Corrective Actions
Record the checks you performed, what the results showed, and how you addressed any concerns. If you used an alternative method or adjusted your analysis, explain why that decision was appropriate. Documenting these decisions helps you describe your methods accurately and report your findings transparently in your dissertation.
Get Expert Help Checking Your Dissertation Analysis in SPSS
Unsure whether you have checked the right statistical assumptions or interpreted your SPSS diagnostic results correctly? Writing Gram can help you review your statistical output, identify potential assumption violations, and determine which issues may need attention before you submit your dissertation.
Get help understanding your diagnostic findings, checking your analytical decisions, and explaining your statistical methods and results accurately in your dissertation. You can get answers to unresolved analysis questions and identify what needs to be addressed before finalizing your results chapter.
👉 Place your order now for help checking your SPSS results, identifying problems with statistical assumptions, and interpreting your findings accurately.
What Should You Do If Your Dissertation Analysis Fails an Assumption Check?
A failed assumption check does not necessarily mean you need to abandon your dissertation analysis.. The next step is to understand the problem and determine whether it affects the suitability of your chosen statistical method or the reliability of your results.
Depending on the statistical test and the issue identified, you may need to:
Check your data: Look for data entry errors, incorrect coding, missing values, or unusual observations that require further investigation.
Review your statistical model: Determine whether your chosen method is appropriate for your research question, study design, and type of data.
Consider an appropriate alternative: Depending on the problem, you may be able to use robust standard errors, a model that accounts for dependent observations, a justified data transformation, or another suitable statistical procedure.
Check whether your conclusions remain reliable: Assess how the problem may affect your estimates, standard errors, confidence intervals, p-values, and interpretation of the results, as applicable.
Document your decisions: Explain which assumption was not met, how you investigated the issue, what action you took, and how it affects the interpretation of your findings.
The appropriate response depends on the assumption and the statistical method you are using. For example, the University of Wisconsin–Madison explains how regression assumptions differ between general linear models and extensions such as logistic regression and models for dependent observations. This is why you should choose a remedy that addresses the specific problem rather than applying the same correction to every analysis.
Do not remove observations, change statistical tests, or transform data simply to obtain a statistically significant result. Any changes should have a sound statistical justification and be reported transparently in your dissertation. If you use an alternative method, explain why it is appropriate and acknowledge any limitations that remain.
When Should You Get Help With Your Dissertation Statistical Analysis?
Getting help with your dissertation statistical analysis can make it easier to understand your results and determine how to address problems with your chosen statistical method. You may benefit from professional support if you are unsure whether your statistical test is appropriate, how to interpret diagnostic results, or how to address issues such as multicollinearity, non-normal residuals, or unequal variances.
You may also need help explaining your assumption checks in your methodology chapter or describing how potential problems could affect your findings.
Duke University explains the main assumptions of linear regression, including linearity, independence, constant error variance, and normality of the error distribution. Understanding these assumptions can help you identify what to check when reviewing your regression analysis.
To help us review your dissertation analysis, have the following information ready:
Your research questions and hypotheses: These establish what your analysis needs to answer.
Your variables and how they are measured: This helps determine whether your chosen statistical procedure is suitable for your data.
Your selected statistical test: Include the method you used and, if known, why you chose it.
Your SPSS output: Include relevant test results, diagnostic plots, and assumption-check statistics.
Your interpretation of the findings: Highlight any results you are unsure how to explain.
Reviewing these details helps connect the diagnostic results to your research questions, statistical method, and overall findings. This can help identify issues that need further investigation and improve how you explain your analytical decisions in your dissertation. For guidance on presenting your findings, see how to write dissertation findings and interpret results correctly.
Get Professional Help With Your Dissertation Statistical Analysis
Struggling to analyze your dissertation data, choose the right statistical tests, or interpret your SPSS results? Writing Gram can help you carry out your statistical analysis, select appropriate methods for your research questions, check relevant assumptions, and interpret your findings.
Whether you need help analyzing your data from the beginning or resolving problems with an analysis you have already started, you can get support with:
Choosing suitable statistical tests based on your research questions, variables, and data.
Conducting your statistical analysis and interpreting the results.
Checking statistical assumptions and addressing potential problems with your chosen method.
Presenting your findings accurately in tables, figures, and your dissertation results chapter.
Get help with the specific stage of your dissertation analysis where you need support, from selecting statistical methods to interpreting results and reporting your findings.
👉 Place your order now for dissertation statistical analysis help, from analyzing your data and running statistical tests to interpreting your results and presenting your findings.